April 24, 2026

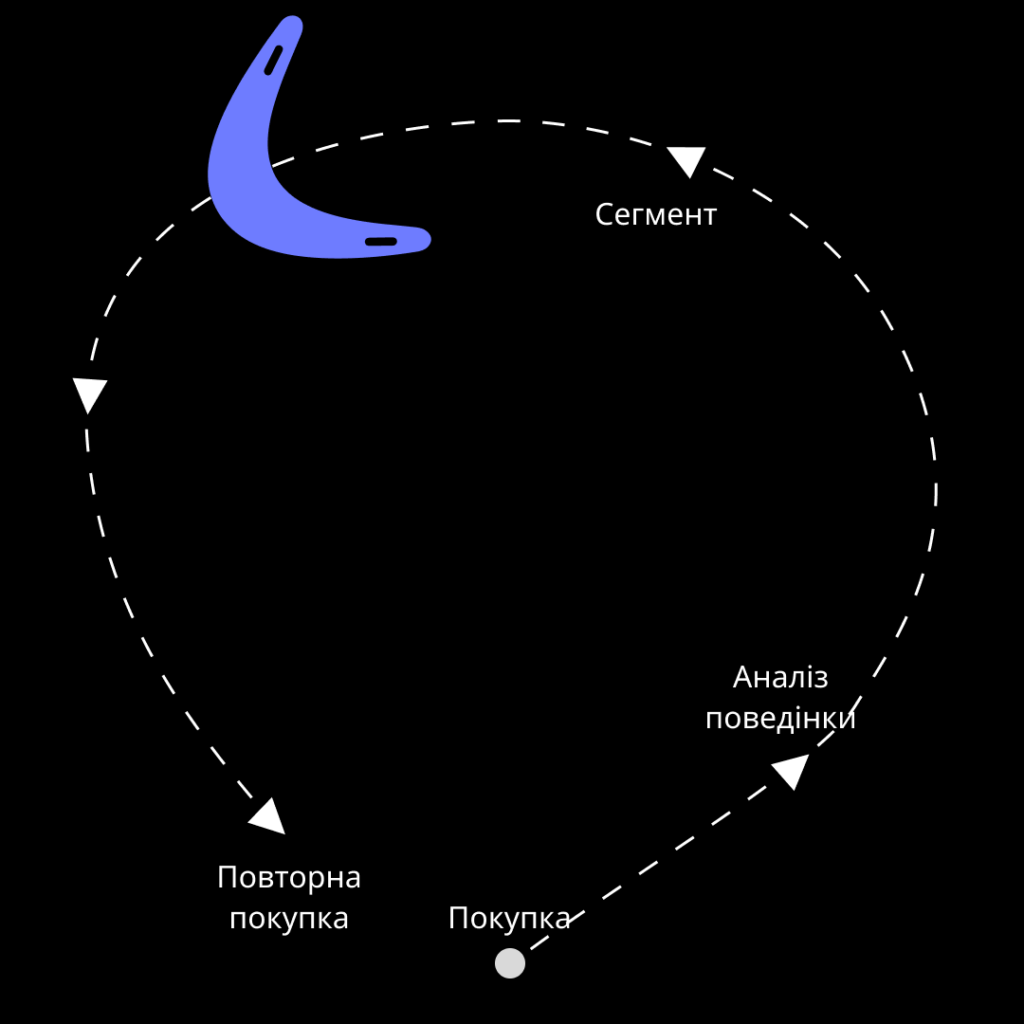
In the late 1990s, the Harrah’s casino chain in the U.S. was falling behind its competitors, who were building one luxurious hotel-casino after another in Las Vegas. Gary Loveman, the company’s chief operating officer at the time, decided to take a different approach: instead of new buildings, he focused on analyzing data about each player. The team expected to find that the most valuable customers were young “whales” who placed huge bets. But in reality, the most profitable segment was mature visitors who gambled moderately but regularly. The company pivoted its entire marketing strategy toward retaining regular players, and the Total Rewards loyalty program became one of the most famous examples of data-driven marketing in the casino industry.
This story clearly illustrates the main idea behind RFM analysis: the amount a customer once spent says little on its own. What matters more is how often and how long ago they returned. In this article, we’ll break down how to perform RFM segmentation of your customer base step by step and how it will impact your business’s repeat sales.
It is a method of segmenting customers based on three behavioral metrics: when a person last made a purchase, how often they do so, and how much money they spend. The acronym stands for Recency, Frequency, and Monetary—three metrics that, when considered together, provide a much more accurate picture than any of them alone.
How much time has passed since the customer’s last purchase. In marketing, Recency is often considered the most sensitive metric: a customer who has purchased recently is more likely to respond to a new offer than one who hasn’t returned in a long time. The time since the last purchase is measured in days, and it’s usually the basis for the fastest triggers. For example, a reminder email sent one month after the last purchase.
Frequency – Purchase Frequency
The number of purchases a customer has made over a specific period. A customer who buys every month is worth more attention than one who placed a single large order and then disappeared. Frequency shows how firmly the habit of buying from you has taken root.
Monetary – Total Spending
The total amount a customer has spent over the selected period. This is the most straightforward metric, but also the most misleading if viewed in isolation from the previous two. That’s why a single large purchase two years ago and ten small monthly purchases can technically add up to the same total, yet the actual value of these two customers will be completely different.
Most companies store customer data but handle it in the same way: one email campaign for the entire database, one discount for everyone, and one retention strategy.
For companies that are just building their analytics infrastructure, RFM is often the first report within a broader system. If a business already has a BI implementation in place, RFM segmentation is usually added as one of the first dashboards: it pays for itself quickly and immediately provides the marketing team with a concrete list of actions.
RFM analysis works well where there is a history of repeat purchases and enough data to identify patterns:
| Business type | Why is it suitable? |
|---|---|
| E-commerce | Many transactions, clear purchase history of each customer |
| Retail chains with a loyalty program | The data is already tied to a specific person through the card. |
| B2B with regular orders | Allows you to see which partners are deviating from the procurement schedule |
| Subscription service businesses | Recency and Frequency directly indicate churn risk |
RFM is less useful for businesses with one-time purchases, where there is no regular history of repeat sales.
Only transactional data is needed for the calculation: customer ID, purchase date, and purchase amount. The data can come from a CRM, an e-commerce platform, or a database export. The key at this stage is to remove duplicate customers (one person with two email addresses) and exclude test and canceled orders, as they otherwise skew the metrics.
The period should be chosen based on the purchasing cycle of the specific business: for a grocery store, this might be 3 months; for a furniture store, a year or more.
Raw numbers aren’t very easy to compare with one another, so they’re converted into scores. The most common approach is to divide the data set into 5 equal groups (quintiles) for each metric and assign a score from 1 to 5.
| Indicator | Score 5 | Score 1 |
|---|---|---|
| Recency | Bought recently | I bought it a long time ago |
| Frequency | Buys often | Bought 1 time |
| Monetary | Spent a lot | Spent little |
As a result, each customer receives a three-digit code, such as 555 (ideal customer) or 115 (hasn’t been around for a while, rarely made purchases, but once spent a large amount).
Based on combinations of R, F, and M scores, customers are grouped into segments. Typically, there are 6–10 groups, depending on how granularly the business wants to manage its customer base. It is at this step that customer segmentation transforms from a table of numbers into a concrete list of names that can be targeted in different ways.
Each segment receives a separate strategy: retention, reactivation, cross-selling, or minimal communication. This is where RFM moves from a report to action and influences repeat sales.
In the RFM model, the number of segments may vary depending on the business, but several basic groups are almost always present.
They’ve made a recent purchase, buy frequently, and spend the most. This is the most valuable segment of the customer base, for whom status, early access, and personalized offers work best.
They return consistently and buy regularly, although their average transaction value may be lower than that of Champions. They form the foundation of the business’s repeat sales: they do not require aggressive incentives but respond well to loyalty programs and cross-selling of related product categories.
They used to buy frequently and in large quantities but haven’t been active in a long time. This is the most costly segment to lose; the company has already invested in acquiring this customer, and their departure means a direct loss. Personalized re-engagement offers and surveys work well here to understand why the customer left.
They haven’t made a purchase in a very long time, and even in the past, their purchase frequency and order value were low. It’s usually not worth spending an active budget on them, as reactivation costs more than they can bring back.
| Segment | R | F | M | Action |
|---|---|---|---|---|
| Champions | High | High | High | Maintenance, status, early access |
| Loyal | High | High | Average | Loyalty program, cross-sell |
| At Risk | Low | High | High | Personal win-back |
| Lost | Low | Low | Low | Minimal or zero costs |
It’s practically impossible to create such a segmentation manually for a large database, which is why most companies automate their RFM analysis of the customer base using BI analytics for e-commerce, where segments update automatically as soon as new order data comes in.
With a small database, you can still calculate R, F, and M in Excel. Beyond that, formulas start to slow things down, pivot tables break with every data update, and someone on the team has to manually recalculate the segments every month.
The main advantage of this approach is that the segments are always up to date. The marketing department doesn’t have to wait for a monthly report from an analyst; it can immediately see who has moved into the risk zone.
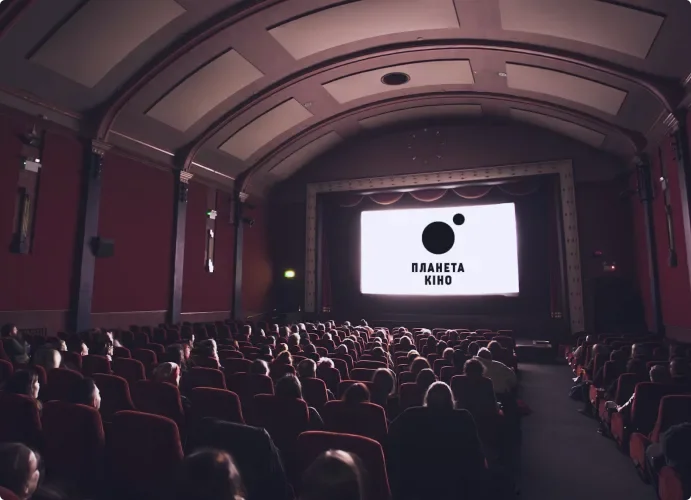
Planeta Kino is a modern Ukrainian cinema chain with advanced digital services: online ticket sales, electronic admission, and mobile apps.
In the Planeta Kino case study, the IWIS team built an analytical system where each metric was linked to a specific report and data source. The work was divided into two streams: core reporting based on an approved structure and an R&D track for testing hypotheses and building ML models. A centralized data warehouse, parsers for open sources, integration with Google Analytics, and a data processing pipeline were also deployed.
The client gained the ability to track the effectiveness of marketing campaigns, analyze key customer segments and communication channels, and calculate LTV. Additionally, the reports revealed a correlation between ticket sales and cross-sales at the bar. This provided the business with 360° analytics on customer behavior, rather than just individual tickets or transactions.
This approach lays the technical foundation for mature customer analytics: when data is collected in a single system, the business can build more accurate segments, particularly using RFM segmentation logic.
If your business already has a purchase history, you can perform a basic RFM analysis without having to go through a lengthy implementation of a complex BI system. The first step is to identify which segments already exist in your customer database and how they impact repeat sales.
The IWIS team will conduct a free consultation during which we’ll review what data you already have and what’s missing for effective RFM segmentation. We’ll also show you what your customer segmentation could look like based on real data.
Submit a request, and we’ll contact you shortly to discuss the details.