

BI Analytics for FMCG
Transform sales, category, and distribution data into management decisions
Schedule a diagnosticWhat changes in your FMCG business after implementing analytics
FMCG (Fast Moving Consumer Goods) is a category of products purchased regularly and frequently: food, beverages, household chemicals, cosmetics. FMCG sales are built on large volumes and rapid turnover, making it virtually impossible to control sales without analytics.
What is FMCG from a management perspective? It’s hundreds of SKUs, dozens of points of sale, and several channels simultaneously. Without a unified analytics system, a manager sees only part of the picture, but after implementing BI, this picture becomes complete and manageable.

Distribution control by territory
Allows you to see coverage for each region, sales representative, and channel. Where the plan is being met, where it is not, and why.

Profitability by category and SKU
It becomes clear which items actually generate profit and which occupy shelf space and budget. Assortment decisions are based on numbers.

Plan/actual by managers and channels
Deviations from the plan are recorded at a moment when they can still be influenced, not at the end of the quarter.

Unified data for the entire management level
The commercial director, marketing, and finance work with the same numbers. Disputes at meetings disappear, as does time spent determining whose data is correct.

Marketing analytics linked to sales
ROMI and channel effectiveness are calculated in connection with actual sales by categories and regions.

Automated reporting instead of Excel
Data is updated without team involvement. The manager receives an up-to-date picture when needed, not two days after the request.
5 signs that your FMCG business already needs an analytics system
In many FMCG companies, data is fragmented, delayed, and does not provide answers to management questions at the right moment.
What a BI analytics system for FMCG looks like
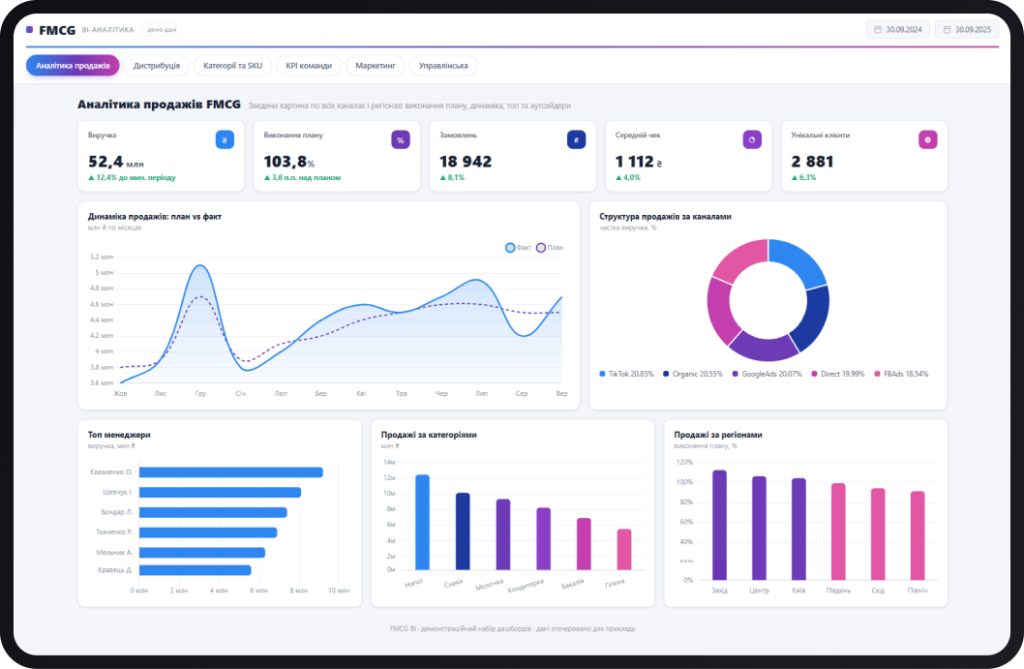
FMCG sales analytics
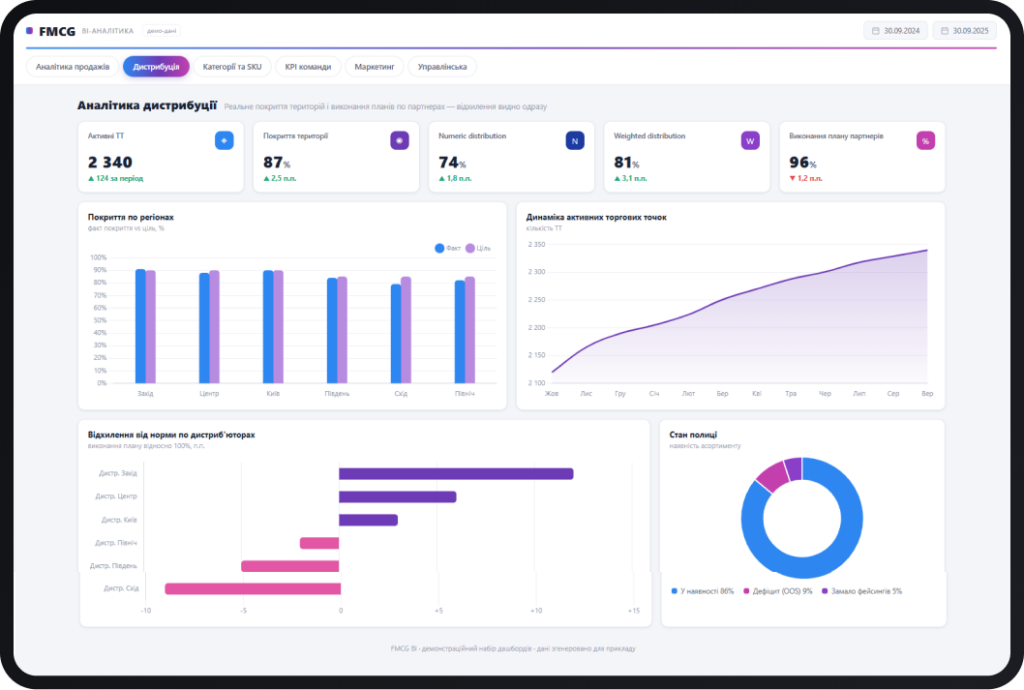
Distribution analytics
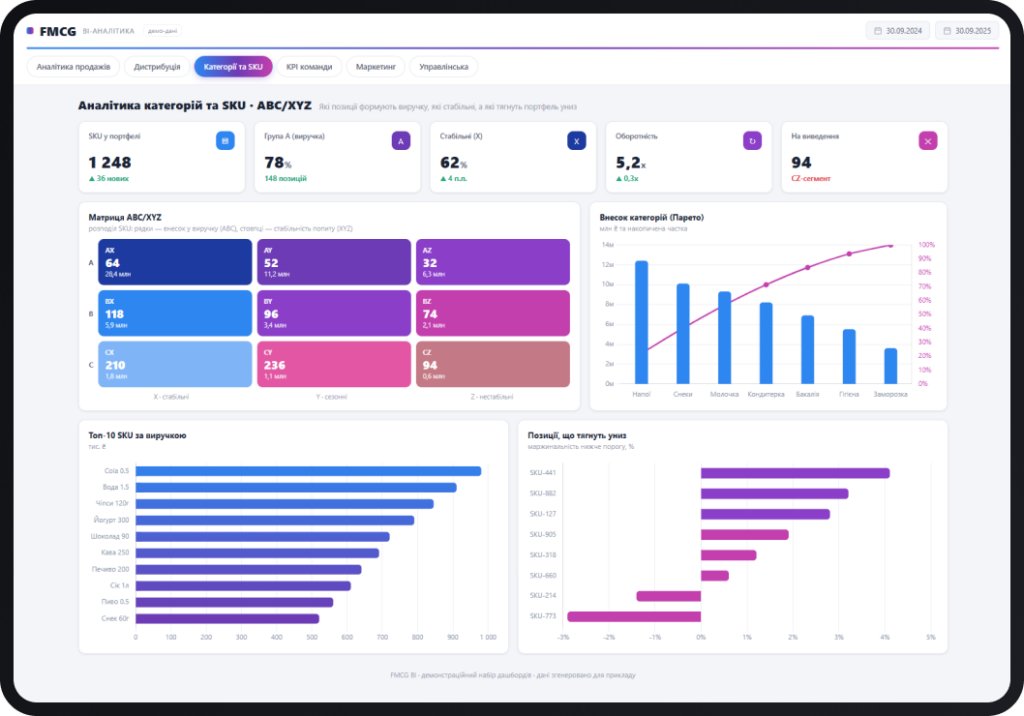
Category and SKU analytics: ABC/XYZ in action
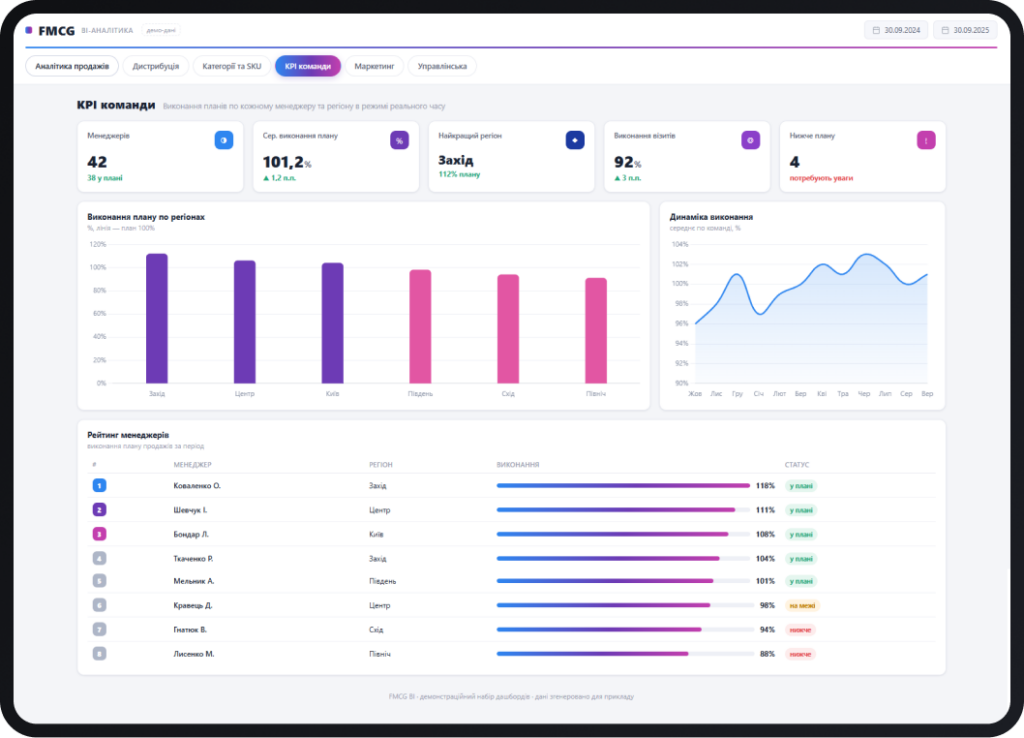
Team KPIs
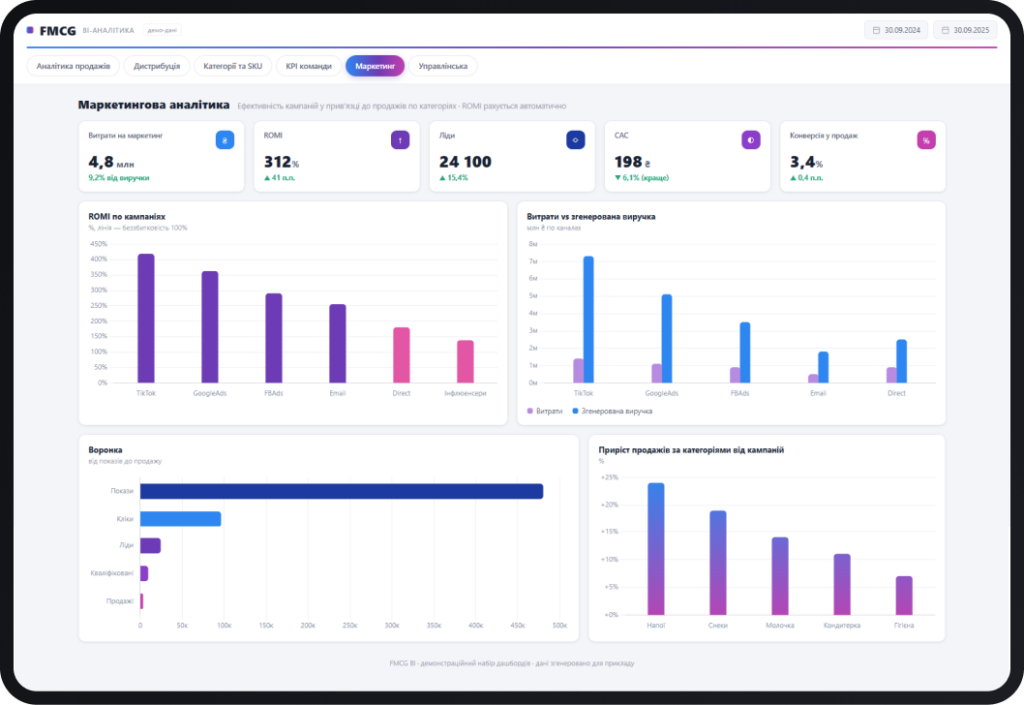
Marketing Analytics
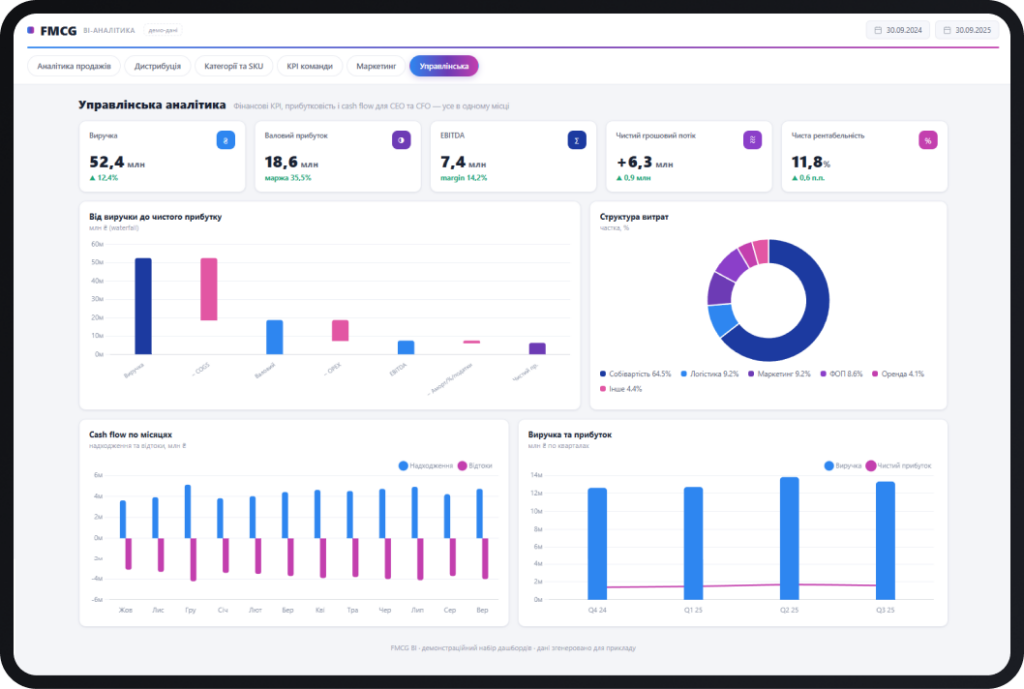
Management Analytics
What tasks business analytics for FMCG solves
Sales
When sales grow in one region and decline in another, it is visible immediately.
- Sales by regions, channels, and managers in real time.
- Plan execution with the ability to drill down to the cause of deviation.
- Dynamics by weeks, months, seasons.
- Top and bottom performers by revenue and margin.
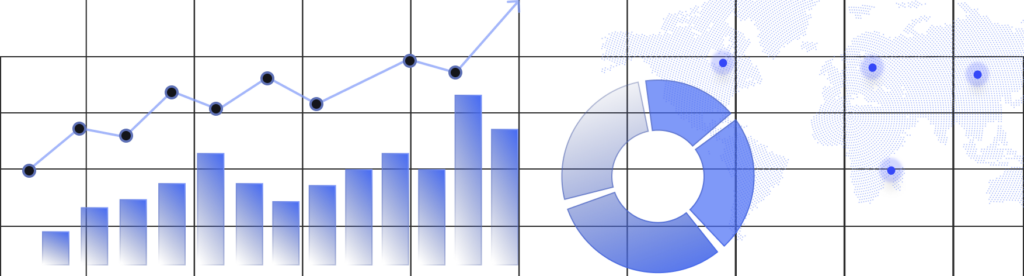
Distribution
An empty shelf at a point of sale or an unfulfilled partner plan does not get lost among dozens of reports.
- Territorial and point-of-sale coverage.
- Plan execution by distributors and partners.
- Analysis of losses due to product unavailability at the point of sale.
- Activity control by sales channels.
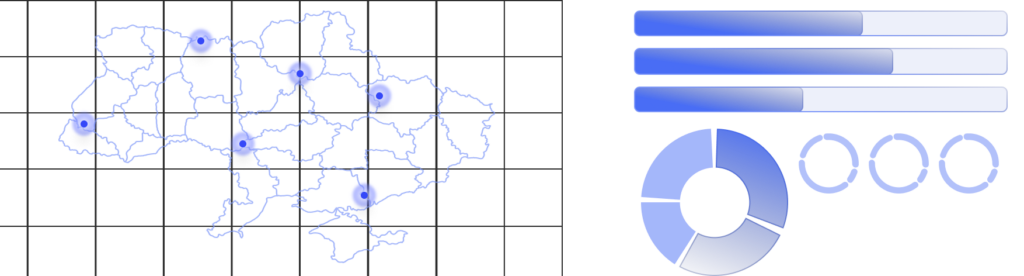
Product category and SKU analytics
A wide assortment does not guarantee profit. Some items may generate turnover but have almost no impact on financial results.
- ABC/XYZ analysis across the entire portfolio.
- SKU and product category profitability.
- Seasonality and demand dynamics.
- Identification of items that occupy budget without results.
Marketing
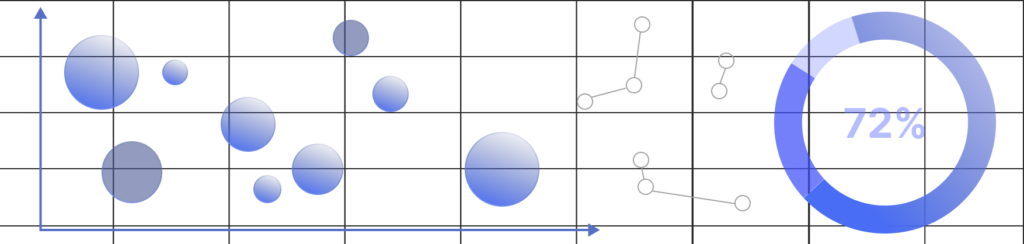
After each campaign, there is a specific answer in numbers.
- ROMI and ROI by campaigns and channels.
- Promo impact on category and regional sales.
- Comparison of activity effectiveness against each other.
- Connection between marketing budget and actual revenue.
Management reporting
During meetings, no one wastes time searching for the correct version of a report or checking discrepancies between departments.
- P&L by divisions and channels.
- Cash flow and operational metrics.
- Financial KPIs with deviation control.
- Access from any device at any time.
How we implement BI analytics for FMCG: from diagnostic to working system
Dashboards are the final step. Before the first report appears, we analyze the business structure, data sources, and management tasks the system must address.
Business diagnostic and data audit
We analyze how reporting is currently structured, where gaps arise between departments, and which management questions remain unanswered. In parallel, we check what data exists in the systems, in what condition, and how reliable it is. This determines the architecture of the entire solution and the subsequent implementation of BI analytics.
Defining KPIs and objectives
Together with management, we record which metrics are critical for each level: CEO, commercial director, distribution manager. Each dashboard is built for specific tasks.
Data source integration
We connect ERP, CRM, accounting systems, and other sources. Data is consolidated automatically, without manual consolidation. After integration, all departments work through a single data source.
Dashboard development
We build dashboards for FMCG covering sales, distribution, categories, marketing, and management reporting. For this, we use modern analytics tools based on Power BI, adapted to specific management tasks. Each screen answers a specific question.
Team training and support
The client's team learns to work with the system independently. Each dashboard includes explanations on how to read the data and what decisions follow from it. When business logic changes or new tasks arise, we update and scale.
Business Intelligence for FMCG is for you if…
You are a manufacturer or distributor with a wide SKU portfolio
You work through several sales channels simultaneously
You have regional sales and a team of sales representatives
Data on sales, distribution, and finance exists in different systems
Management receives reports with a delay or manually
The business is at a scaling point and control is needed
Frequently asked questions about BI analytics for FMCG
What systems can be integrated?
We connect any data sources: ERP, CRM, accounting systems, Excel files, marketing platforms. If the data exists in a system, it can be brought into the analytics.
Do we need to change our data sources?
No. The BI system is built on top of your existing infrastructure. Your current systems stay in place and become sources for a single analytics environment.
How long does implementation usually take?
Diagnostics and a data audit usually take about 1-2 weeks. The first working block, for example sales or distribution analytics, launches in 4-6 weeks. A full system covering all areas — sales, distribution, categories, marketing, management reporting — takes 2-6 months, depending on the number of sources and the complexity of the business structure.
Can we start with just one area?
Yes, this is standard practice. We start with the block where the management pain is greatest, then grow the system from there.
Can the system scale as the business grows?
Yes. The system is built with scaling in mind: new data sources, areas, and users are connected without reworking the entire solution.
Is there support after launch?
Yes. Technical, analytical, and consulting support within an SLA.