


February 19, 2026

Imagine a morning management meeting. The CFO brings one profit report, the commercial director brings another, and marketing presents a third. The numbers don’t match—even though they’re for the same company and the same period. A meeting scheduled for 30 minutes drags on for two hours. And it ends not with a decision, but with a promise to reconcile all the spreadsheets by Friday.
For most Ukrainian companies, this is a weekly reality. The data exists, but it’s scattered across different systems, outdated, and inconsistent. That’s exactly why Business Intelligence is becoming an essential management tool in Ukraine.
The term “Business Intelligence” may sound complex, but it describes a simple idea: transforming raw company data into clear, actionable information for management decisions. It’s not just about collecting data—it’s about making sure the right person sees the right numbers at the right time.
BI is not a single tool or a standalone program. It’s an architecture that pulls data from various sources (CRM, ERP, accounting systems, website, ad platforms, warehouse systems), processes it, stores it in a single repository, and presents it through intuitive reports and interactive dashboards.
The difference between BI and traditional reporting
Traditional reporting might be an Excel file that someone manually put together for the previous month. It shows what has already happened—and only the data someone decided to include. If the manager is sick or forgets, the report simply doesn’t exist.
BI tools work fundamentally differently: data is collected automatically from all systems in real time or on a schedule. Reports are generated on demand in seconds, and any executive can check any metric without an analyst’s help. Most importantly, everyone in the company is looking at the same numbers, calculated using the same methodology.
Another significant difference is the depth of analysis. A traditional report will show total monthly revenue. But a data‑driven decision based on BI lets you see revenue broken down by region, manager, product category, and sales channel—and compare all of that with the same period last year or with budget targets, all in just a few clicks.
| Parameter | Traditional reporting | BI system |
|---|---|---|
| Data update frequency | Once a month or week | Real‑time or daily |
| Data sources | 1‑2 manually prepared files | All company systems, automated |
| Depth of analysis | Shallow, aggregated | Drill‑down to a single transaction |
| Dependence on people | High | Minimal |
| Report preparation time | Hours or days | Seconds or minutes |
And while one company is still waiting for its report on Monday, another has already fixed the problem on Friday.
In 2026, the single greatest scarcity in business is the manager’s attention. There is more data, more sales channels, and more teams. But there is less time to analyze the situation. When managers make decisions based on incomplete or outdated data, it costs real money. The average annual loss from poor data quality is $12.9 million per organization.
These are exactly the kinds of mistakes you might not notice at the time, but they are the ones that gradually eat away at your profits.
Take an e‑commerce business that spends 20,000onadvertisingeverymonth.Ifjust204,000 per month. Over a year, that’s $48,000.
And that’s only marketing. Add in excess inventory, inefficient logistics, weak sales conversion — and the total grows much larger.
Swiss Krono – an international building materials manufacturer with a factory in Ukraine. Analytics were done in Excel: management had no convenient way to monitor production KPIs, and preparing any report required manual work.
We identified the key metrics and built a model in Power BI with an adaptive dashboard. Managers saw the problem areas immediately after the BI system was implemented — without a single extra meeting with an analyst.
Skarbnytsia – the largest pawnshop chain in Ukraine, with 400+ locations. The company had accumulated a huge volume of transactional data in a legacy ERP system but couldn’t put it to use – no direct export, no integration with modern analytics tools. Launching any data initiatives (customer segmentation, personalized communications) was impossible.
We built a centralized data warehouse and set up automated update schedules and data quality checks. As a result, the company gained a reliable foundation for all future analytics initiatives — a warehouse that scales with the business and isn’t locked into changes in the legacy system.
This is a separate system for analytics that does not interfere with the company’s core operational software. While the CRM is processing orders, the data warehouse simultaneously handles reports, period‑over‑period comparisons, and large datasets. The business gets fast analytics without putting a load on its transactional systems.
ETL (Extract, Transform, Load) is the process that automatically pulls data from different systems, cleans errors, and consolidates everything into a single, unified structure. This is what determines whether you can actually trust the numbers on your dashboard.
In a BI implementation, the quality of the ETL architecture often decides whether the entire system will be useful. Here’s a classic situation: data from the CRM and data from accounting don’t match because one system has a customer listed as “Dandelion LLC” while the other has “Dandelion, LLC.” In a consolidated report, they look like two different customers. The ETL layer detects and fixes such discrepancies automatically.
A well‑designed dashboard answers a specific question before the user has even had time to formulate it. The CFO opens a page and within 10 seconds understands where the budget deviations are, where overdue receivables are, and which division has exceeded its targets – without making an extra call to an analyst.
One screen, one decision. A dashboard for the CEO and a dashboard for a sales manager are fundamentally different tools with different levels of detail. Trying to show everything on one screen means showing nothing useful.
Context matters more than the number. Not just “revenue of 3.2million,”but”3.2 million – that’s +12% vs. target and -4% vs. the same month last year.”
Drill‑down. The ability to go from an overview down to the details with a single click – from company‑wide numbers to a specific manager, SKU, or transaction.
Mobile accessibility. A manager must be able to see key metrics from a smartphone, not only from an office computer.
The most popular BI system for businesses in the corporate segment, especially among companies that already use Microsoft products. Deep integration with Excel, Azure, Teams, and SharePoint, a large library of connectors to external systems, and an active developer community make Power BI the first choice for most medium and large-scale projects.
| Parameter | Details |
|---|---|
| Cost | From $14/user/month (Power BI Pro) |
| Strengths | Integration with MS ecosystem, DAX formulas, large community |
| Limitations | Complex licensing model, limitations in the free version |
| Best for | Companies on Microsoft 365 |
A leader in enterprise analytics with a reputation as the gold standard for building complex interactive reports. Acquired by Salesforce in 2019. Popular where analytics is a core business process.
| Parameter | Details |
|---|---|
| Cost | From $75/user/month (Tableau Creator) |
| Strengths | Most powerful visualization, intuitive drag-and-drop |
| Limitations | High cost, steep learning curve |
| Best for | Large companies with a dedicated analytics team |
Google Looker Studio (formerly Data Studio) is a free tool for basic reporting with simple integration to GA4, Google Ads, and BigQuery. Looker is the enterprise version with the LookML modeling language for complex architectures.
| Parameter | Details |
|---|---|
| Cost | Looker Studio is free. Looker – price on request |
| Strengths | Seamless integration with the Google ecosystem |
| Limitations | Looker Studio is limited in complex calculations |
| Best for | Companies on Google Cloud; marketing teams |
Metabase is an open-source platform for teams with limited budgets and technical resources for self‑deployment. A simple interface where basic reports can be built without knowing SQL. The self‑hosted version is completely free.
| Parameter | Details |
|---|---|
| Cost | Self‑hosted is free. Cloud starts at approx. $500/month |
| Strengths | Open‑source, simple interface, fast start-up |
| Limitations | Limited enterprise functionality |
| Best for | Startups, tech companies, IT teams |
Business intelligence in Ukraine is relevant for any business with more than one department, more than one data source, and more than one decision‑maker. But there are segments where BI delivers the fastest and most tangible return.
Retail & e‑commerce. Managing inventory, analyzing sales funnel conversion, marketing channel attribution, forecasting demand by season. A company with tens of thousands of SKUs simply cannot manage its assortment without automated analytics.
Manufacturing. Real‑time monitoring of deviations from planned targets, analyzing equipment downtime and its causes, comparing efficiency across production lines or shops. Experience shows that often 20% of equipment causes 80% of delays – but you can only see this when the data is collected and structured.
Financial companies & insurance. Portfolio analytics, risk management, regulatory reporting – all of this requires fast access to accurate, up‑to‑date data. At any serious scale, manual processes are simply impossible here.
Distribution & logistics. Sales rep efficiency by region, monitoring customer accounts receivable, warehouse utilization – metrics that directly impact operating profit and require daily monitoring.
Multi‑location businesses (restaurants, clinics, salons). Comparative analytics across locations, monitoring revenue and average check by shift, seasonality analysis. Without a centralized dashboard, the owner of a network of 10+ locations is essentially managing the business by guesswork.
When answering a simple management question takes several hours and requires multiple people – the business has outgrown its tools.
Implementing BI requires a clear sequence and the involvement of business stakeholders. Most failed BI implementations collapse because there is no clear answer to the questions: who is this for, and what decision is it supposed to make easier?
Step 1. Audit current data sources. Inventory all systems: CRM, ERP, accounting, website, ad platforms, warehouse system. For each source, assess data quality: are there duplicates, gaps, incompatible formats? Often at this stage, it turns out that data from different systems contradicts each other – and this must be fixed before building any analytics.
Step 2. Define key business questions. BI is not built for everything at once. You have to start with specific questions. For example: understanding profitability by product, or seeing daily sales plan performance broken down by manager. These questions determine the architecture and priorities. A typical mistake is trying to build a complete BI system covering every possible scenario in the first iteration.
Step 3. Choose the platform and design the architecture. Based on data volume, the company’s tech stack, and budget, choose between Power BI, Tableau, Metabase, or a custom solution. In parallel, design the data warehouse schema: which tables are needed, what relationships exist between them, and what level of data granularity is required.
Step 4. Build the ETL. Develop connectors to each source, configure update schedules, and define transformation rules. This is the most labor‑intensive part of the project – and the most important. The quality of the ETL determines how much you can trust the numbers on your dashboard.
Step 5. Develop dashboards. Prototype together with end‑users – not after the system is ready, but during the process. It is at this stage that dashboard development determines whether the system will actually be used every day.
Step 6. Train the team. BI will not deliver results if managers don’t know how – or aren’t accustomed – to using it. Training is a mandatory part of the project. The ideal format is hands‑on support during the first weeks of real‑world use.
Step 7. Support and evolve. Business changes, and BI must change with it. New data sources, new KPIs, changes in reporting structure – regular dashboard reviews are essential for the system to remain useful a year after launch.
How much does a BI project cost in Ukraine?
Cost depends on the number of data sources, the chosen platform, the complexity of business logic, and the extent of customization. Estimated ranges for the Ukrainian market as of 2026:
| Project type | What’s included | Cost |
|---|---|---|
| Basic BI | 1–2 sources, 3–5 dashboards, Power BI or Looker Studio | From $3,000 |
| Mid‑sized BI project | 3–6 sources, ETL layer, Data Mart, 10–15 dashboards | From $10,000 |
| Enterprise BI | Full data warehouse, many sources, custom analytics | From $30,000 |
| Support & maintenance | Monthly retainer after launch | From $500/month |
For e‑commerce companies, IWIS offers a separate fast‑track BI analytics package: a ready‑made solution including dashboards, RFM customer segmentation, and ad channel analytics. This is suitable for businesses that need results without a long enterprise project.
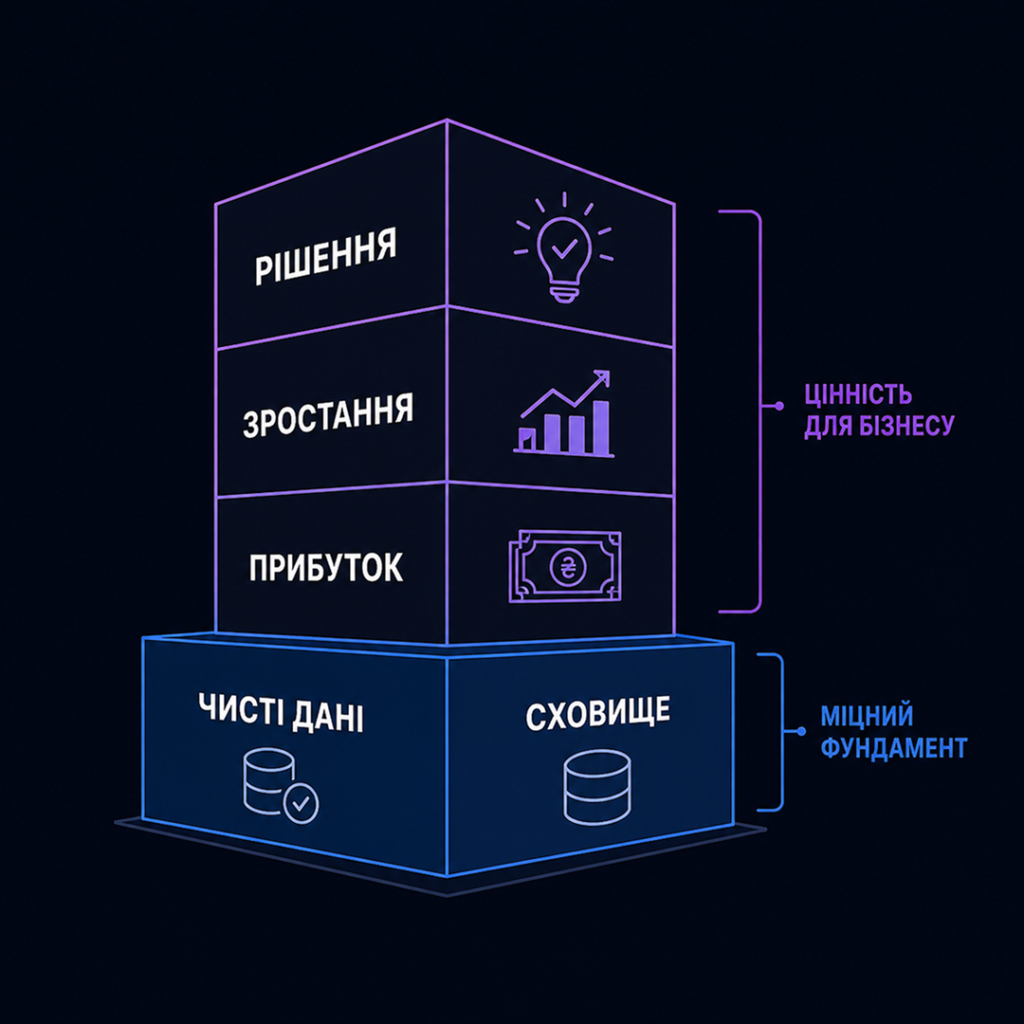
There is one more important nuance that is often underestimated: BI tools by themselves do not solve the problem. The most critical and expensive part of any BI project is building high‑quality architecture and the ETL layer. Companies that try to cut costs here end up with a beautiful dashboard that cannot be trusted.
IWIS specializes in building BI systems for businesses based on Power BI and custom solutions. Over the years, we have worked on dozens of projects in retail, manufacturing, distribution, and e‑commerce. We know where businesses lose the most money due to a lack of quality analytics.
If you want to understand whether your company is ready for BI and where to start – book a free consultation. In 60 minutes, we will assess the current state of your data, identify priority tasks, and provide a roadmap for implementation. Just a constructive conversation – no pushing popular solutions.