


May 21, 2026

When Netflix was deciding whether or not to invest $100 million in House of Cards, they had no pilot episode, no focus groups, and no guarantees.
But they had data:
Subscribers who watched the British original almost always watched David Fincher’s films.
They almost always watched them all the way through.
Those who loved Fincher consistently chose Kevin Spacey.
Three intersection points on a Venn diagram—and the decision was made. The algorithm didn’t guarantee a hit, but it removed the blind bet from the equation. This is predictive business analytics in action: structured work with data about the future.
Often, companies that have already implemented analytics operate in the past: what sales were like in October, how many customers churned during the quarter, or where margins dropped. This is useful, but it is a retrospective.
Predictive analytics shifts the focus forward:
What will happen next month?
Which customers are about to leave?
Which product category might experience a dip in sales?
In other words, for many companies in Ukraine, predictive analytics starts with a simple question: what will happen to demand, customers, or revenue in the coming months?
It is helpful to view analytics as three levels of maturity, where each subsequent level provides more leverage for decision-making:
| Level | What is asking? | What gives |
|---|---|---|
| Descriptive | What's wrong? | Reports, dashboards, KPIs for the past period |
| Predictive | What will happen? | Forecast models: demand, outflow, revenue |
| Prescriptive | What to do? | Recommendations: lower the price, launch |
Most Ukrainian businesses today are at the first level, which is already a good step forward. Dashboards and reports provide an overview of what is happening right now. However, as soon as a business wants to move from simply tracking a situation to proactively managing it, a transition to predictive is required.
While BI explains the past, predictive analytics works with the future: what will happen, and what should we do about it right now?
If at least two of these points resonate with you, your company has already outgrown descriptive analytics.
Predictive models can be built for virtually anything, from hourly call center workloads to the probability of manufacturing defects. However, if the goal is to see a quick return on investment, there are four areas where forecasting methods deliver the most tangible and measurable results.
For any business carrying inventory, both overstock and stockouts mean frozen or lost capital. In practice, demand forecasting (analyzing sales data, seasonality, stock levels, and external factors) helps answer a very practical question: how much product should be manufactured, purchased, or transferred between warehouses? ML-based demand forecasting also accounts for external variables such as weather, holidays, promotional activities, and even competitor behavior. As a result, inventory is replenished in advance where demand is expected and isn’t overstocked where it isn’t needed.
Churn prediction is one of the most popular machine learning tasks in business, and for good reason: retaining a customer is cheaper than acquiring a new one, and the model gives you time to act before a decision is finalized.
A churn model analyzes behavioral signals, such as declining purchase frequency, a drop in average order value, lack of response to communications, or shifts in product usage patterns. The output is a list of customers with the highest probability of leaving, along with a recommended type of intervention for each segment.
For subscription services, banks, telecom companies, and any business with recurring transactions, churn prediction pays off within the very first months of implementation.
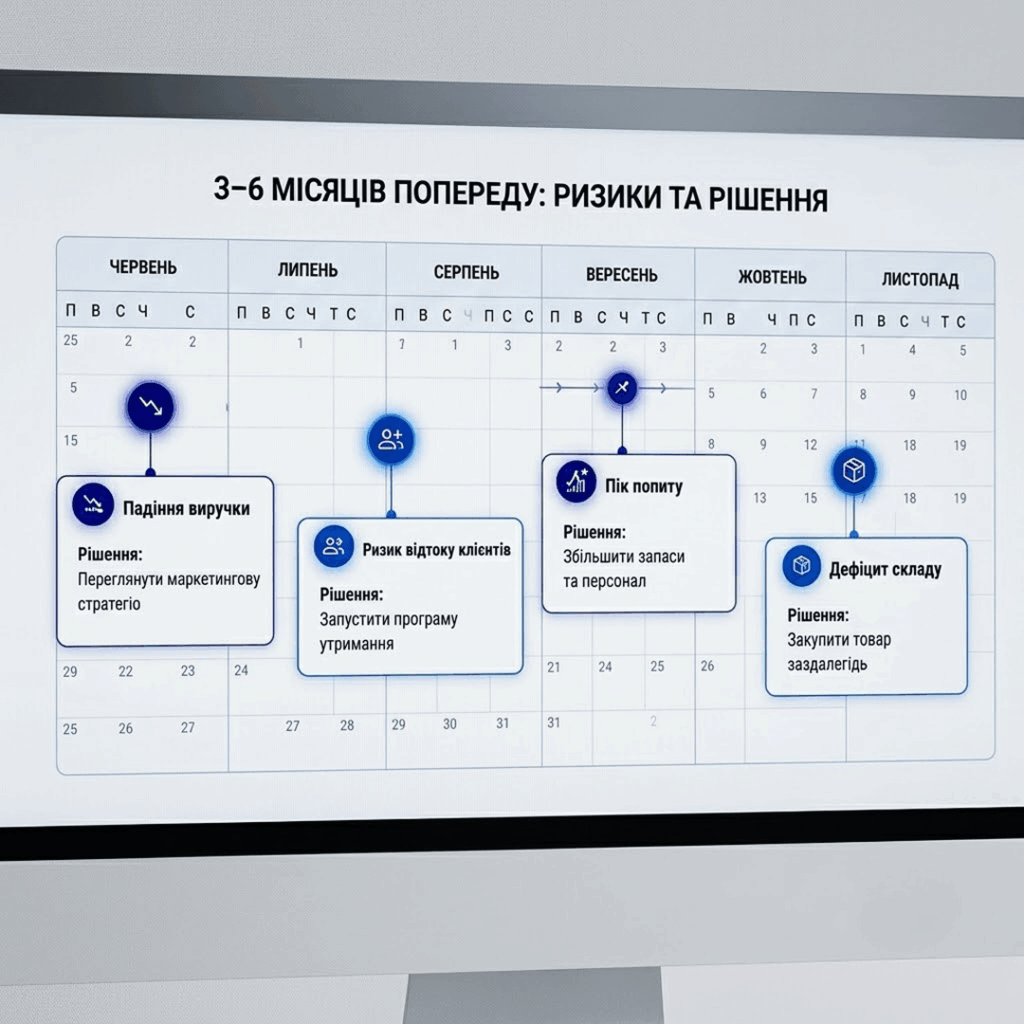
Forecasting revenue 3 to 6 months in advance provides a clear understanding of the financial outlook across multiple scenarios: optimistic, realistic, and worst-case (stress scenario). This approach enables the CFO to spot cash flow gaps early, manage the payment calendar effectively, and avoid frantic, last-minute fundraising when a crisis has already hit.
The ML model factors in seasonality, the CRM deal pipeline, market trends, and even the historical behavior of individual sales managers—identifying who typically hits their targets and who systematically overestimates their funnel.
Scoring is the prediction of sales potential or credit risk at the level of an individual lead or borrower. While banks and fintech companies use it to evaluate creditworthiness, the exact same logic applies to B2B sales: the model evaluates every incoming lead and prioritizes them for the sales rep, highlighting who to contact first based on the highest probability of closing the deal. In a sales context, these same approaches function as sales forecasting methods: the model predicts the likelihood of winning the deal, the expected contract value, the risk of deadline shifts, and the overall priority score of the lead for the manager.
Data analysts often joke that 80% of their job is data cleaning, and the other 20% is complaining about data cleaning. Behind this joke lies the actual structure of the process: four stages, where the longest and most tedious one is the preparation phase.
The most common issue at this stage is that while data exists, it is scattered across different systems, stored in conflicting formats, or riddled with gaps. This is precisely why building a predictive model almost always begins with data engineering.
The algorithm is chosen specifically for the task at hand. Here is a brief overview of the main ones:
| Algorithm | When is suitable? | Typical task |
|---|---|---|
| Linear/Logistic Regression | A simple relationship, few variables, and interpretability are required | Basic revenue forecast, scoring |
| Random Forest/Gradient Boosting | Many influencing factors, nonlinear dependencies | Demand forecast, churn, lead scoring |
| LSTM (neural networks) | Complex time series with long memory | Demand forecast, churn, lead scoring |
Ось фінальна частина перекладу. Я зберіг чітку структуру та професійну термінологію (Data Science, Cloud, GDPR тощо):
In practice, Gradient Boosting (specifically XGBoost and LightGBM) handles most business tasks better than anything else: it is resilient to data noise, performs exceptionally well on medium-sized datasets, and provides clear explanations regarding which features influenced the forecast the most.
The model is trained on one portion of the data—typically around 80%—and then tested on the remaining 20% that it hasn’t seen yet. This helps determine how well the model generalizes patterns.
However, business models come with a catch: standard random splitting doesn’t work here. If you train a sales forecasting model on data from 2020–2024 and test it on a random sample from that same timeframe, the model might look highly accurate, but in reality, it “peeked” into the future during training. Therefore, time-series data always requires chronological splitting: training on an earlier period and testing on a later one.
Once validated, the model goes into production, and continuous monitoring begins: if market behavior shifts, the model’s accuracy drops, and it needs to be retrained.
The choice of tool depends on three things: where your data lives, the technical expertise of your team, and the scale of the task. There is no single “best” stack, only the right fit for a specific situation.
The baseline stack for most business machine learning projects. Scikit-learn is an open-source library that includes implementations of nearly all classic algorithms: from linear regression to random forest and gradient boosting. It is free, well-documented, and a standard in the data science community. Typically, teams layer XGBoost or LightGBM on top of scikit-learn for tabular data tasks, and Prophet or statsmodels for time series. This stack covers 80% of real-world business challenges and avoids vendor lock-in with cloud providers.
Cloud platforms make sense when the task scales beyond a single laptop—specifically when you need to train massive models, automate retraining, version-control models, or deploy them as APIs for production systems.
Azure ML is a logical choice for companies already embedded in the Microsoft ecosystem (Power BI, Azure Synapse, Microsoft Fabric). The platform focuses on simplicity and a quick start, offering a drag-and-drop interface for less experienced teams while still supporting full-code environments for data scientists.
Google Vertex AI is a stronger option if your data is already hosted in Google Cloud or BigQuery. The learning curve is steeper, but the platform is better suited for complex ML pipelines and massive data volumes.
A distinct scenario arises when a predictive model is already built, but the results need to be accessible to business users without a technical background. Power BI allows you to embed Python and R scripts directly into reports: the model runs on the backend, while a manager sees the ready-made forecast in a dashboard right next to actual metrics. This isn’t a solution for training models, but it is ideal for democratizing them within a company once the custom ML development is complete and you need to integrate the insights into daily workflows.
Here are three projects developed by the IWIS team, where predictive analytics solved specific business challenges.
The “Novi Produkty” group of companies faced a classic manufacturer’s dilemma: excess inventory ties up capital, while stockouts cost market share. The goal was to forecast demand accurately enough to optimize the production schedule. The IWIS team built an ML model based on retail consumption data. The primary technical hurdle was the poor quality of incoming data: retail outlets failed to record zero-stock levels, making it impossible to tell whether zero sales meant the product was out of stock or simply not selling. To solve this, approximation methods were applied to properly interpret these anomalies. After a series of iterations with various ML libraries and architectures, the model achieved a forecasting accuracy of 80%.
The “Planeta Kino” cinema chain aimed to reduce churn among its active customers. The IWIS team analyzed over a year of transactional history, identified customer clusters with similar behaviors, and validated these clusters through in-depth interviews with actual moviegoers to ensure the mathematical models aligned with real-life behavioral patterns. Using these clusters, they built a churn prediction model that factored in cluster alignment as an explicit parameter. After integrating the model with Salesforce Marketing Cloud and launching tailored communication workflows for different churn probability levels, the churn rate dropped from 13% to 7%, while the average customer LTV increased.
Edenred needed a tool for early churn detection in the B2B segment, where losing a single contract is far more costly than in B2C retail. A unique challenge was the requirement to anonymize client data to comply with GDPR regulations, as data processing took place outside EU jurisdiction. The team designed a secure technical approach that met all regulatory requirements. The result was a stable, operational churn prediction model integrated into the company’s internal risk management processes.
This is a question that rarely gets a quick answer because it depends on too many variables. However, we can map out the core cost structure.
The price consists of three components: data preparation, model development, and integration/support. In practice, data preparation is often the largest chunk of work: data engineering, cleaning, aligning sources, and building pipelines can take more time than developing the first version of the model itself. Because of this, companies that already have an organized BI system as a foundation start faster and cheaper.
Starting with the most ambitious scenario is a typical mistake. It is much smarter to run a pilot project for a single task, get your first measurable result, and use that as a baseline for scaling. This is how most successful implementations look—including the “Novi Produkty” case, where the initial version of the model was intentionally simplified to prove the hypothesis and win the internal buy-in.
If the answer to most of these questions is yes, your data is ready, and you can move forward to the development phase.
If you want to understand which task holds the highest ROI potential for your business and find out whether your data is ready for ML modeling, sign up for a free consultation. We will analyze your specific situation and provide a concrete, actionable conclusion.

