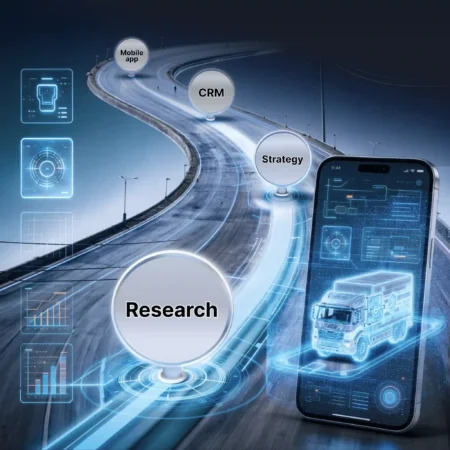
Change strategy for Atlant-M automotive holding: consulting, audit, and selection of a CRM system
Atlant-M is an official Volkswagen dealer with over...
View more
Experience Overview
In business, the most obvious answers are often hidden right in front of our eyes.
But when there's a lot of data, it's practically impossible to see it: reports exist, tables exist, but understanding doesn't.
Without a complete picture, business loses profit, speed, and control every day.
Business intelligence is not just interactive dashboards. It's a navigator and control system that helps make strategic decisions faster, more accurately, and with greater confidence. It's real business information at one click, in real time.
We will teach your data to speak, and it will show:
– what truly drives results
– where efficiency is lacking
– where unnecessary money and resources are wasted daily
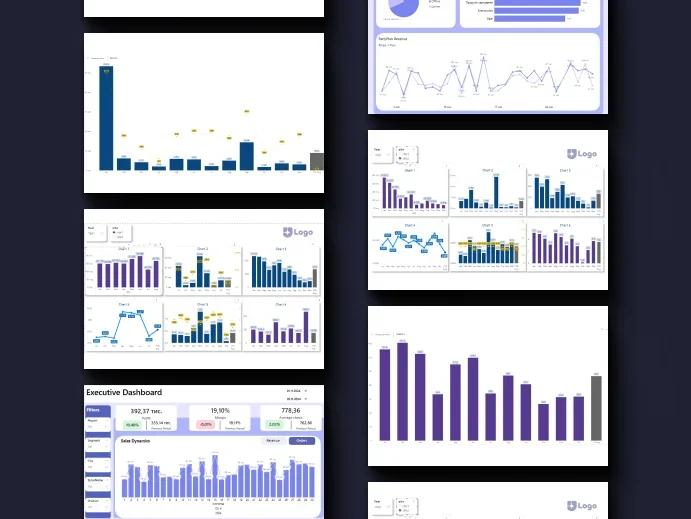
Building management reporting is creating a single data source that executives use for daily decision-making.
We use Power BI - a powerful visualization system that allows collecting all data in one place, setting up dashboards for each role in the company, and seeing changes in real time.
We help build analytics that connects all marketing channels, allows tracking customer behavior, and calculates profitability of each funnel stage.
Analytics provides not just numbers, but real solutions: which channel brings the most profit, which campaign works better, and when a customer is ready for a repeat purchase.
We set up systems that connect data and allow teams to make decisions quickly based on real numbers. This way, you can see what's happening right now with inventory, orders, production, plan execution, and more.
We help build predictive models for key business metrics: demand, profit, inventory, finances. These are practical tools for proactive decision-making.
Technologies
Our Approach
At IWIS, we see business intelligence as a management system, not just a set of reports. Our approach allows executives to get a real picture of the business and act based on verified data.
Our key differentiators:
We don't limit ourselves to visualization, but perform auditing, cleaning, and standardization of data to make it trustworthy.
Each metric has a clear calculation methodology. Finance, marketing, and sales no longer argue with each other.
We launch the first management dashboards in Power BI lite version format so you can see the benefits immediately.
CEO sees strategic metrics, CFO sees profitability and cash flow, store manager sees their location's efficiency.
We've come in after other contractors and restored trust in analytics.
Atlant-M is an official Volkswagen dealer with over...
View more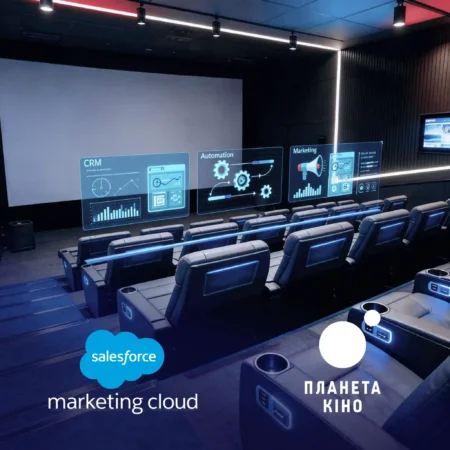
Personalized customer engagement platform for Planeta Kino based...
View more
SWEET.TV is one of the most powerful Ukrainian...
View more SWEET.TV – один із найпотужніших українських OTT-сервісів, що...
View more
Good Wine is a cult Ukrainian brand that...
View more
Planeta Kino is a modern Ukrainian cinema chain...
View more
Looking for a reliable technical partner? We are ready to join your project at any stage – from idea to launch.
Fill out the form, and we will contact you to discuss the project.
Senator Business Center, 32/2 Knyaziv Ostrozkykh St. Kyiv, Ukraine, 01010
Це підхід до прийняття рішень на основі фактів. Йдеться про системне збирання, обробку та візуалізацію бізнес-даних для того, щоб керівники і команди бачили, що відбувається в компанії в реальному часі. BI відповідає на питання що сталося, чому і що з цим робити. Це дашборди, аналітичні моделі, автоматичні звіти, які дозволяють бачити бізнес як цілісну систему.
Business analytics shows which directions bring profit and which drain resources. You see which customers drop off, where processes stall, what affects conversion. It’s a way to spot problems before they turn into losses. And conversely – to scale what works. Decisions become more precise, reactions faster.
BI is about real-time visibility: dashboards, reports, metric control. Business analytics is about analyzing causes, forecasting, and scenario modeling. Conventionally: BI shows profit dropped in September, analytics explains why, what happened to customer behavior, and how to fix it. We usually combine both approaches.
It all depends on the task. If real-time metrics are needed – we build interactive dashboards. If understanding customer behavior or demand forecasting – we connect analytical models. If consolidating everything into one window – we create a unified analytics portal. In most cases, we start with an audit: what’s already there, what decisions are made, where money is lost. Then we tailor the solution to the business, not vice versa.
Data alone gives nothing. But properly presented information speeds up decisions, reveals problems, and shows growth points. BI lets you focus on profitable directions and optimize costs. For example, you see conversion dropped in one region and launch a new strategy test within an hour.