Deep Analytics for Planeta Kino: Marketing, Customers, Cross-Sales
Planeta Kino is a modern Ukrainian cinema chain that has transformed the movie-going experience into a high-tech service.
View more
About the project
Swiss Krono is not just a brand, but one of the world leaders in the production of wood-based building materials. The company owns factories in Ukraine and more than 10 countries around the world. They provide a full cycle of production of laminate, chipboard, and OSB boards. Swiss Krono successfully combines technology with natural raw materials and shapes the future of construction and design.
The company used Excel-based reports, but this approach made it difficult to get a clear and timely view of production processes.
Manual data updates were time-consuming, and KPI analysis required constant clarifications and cross-checks.
Core issues:
Swiss Krono needed a modern solution to automate data processing, simplify analysis, and give management real-time visibility into production performance.
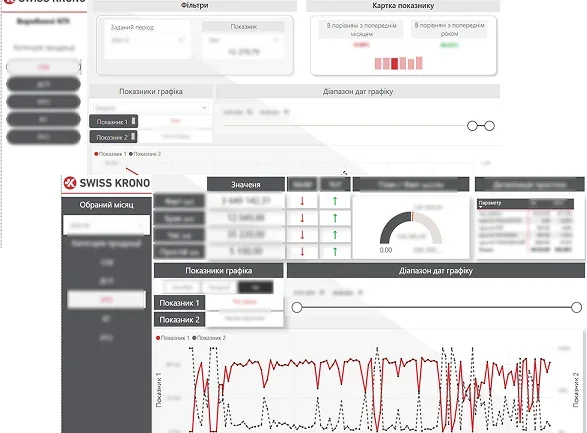
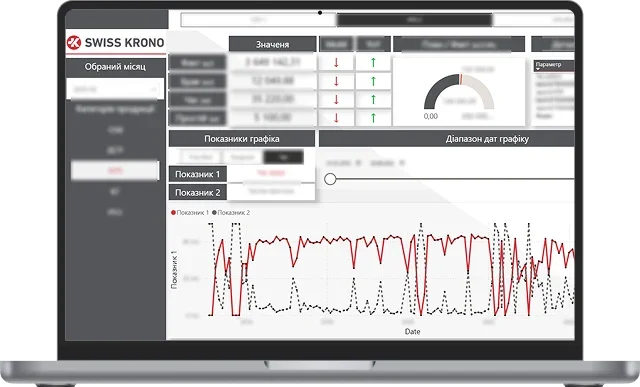
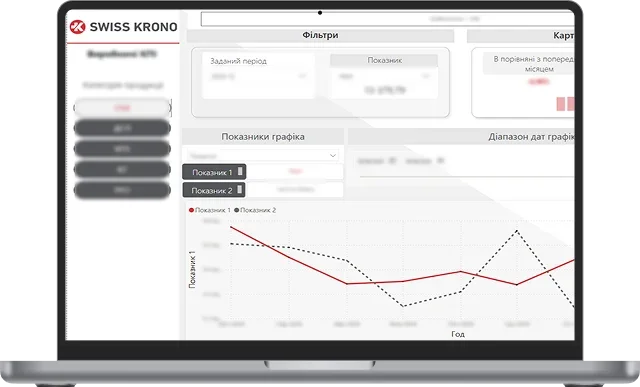
The adaptive dashboard shows the actual state of production, identifies deviations, and helps you take action before problems arise.
Our approach:
IWIS specialists began working on the project by defining key production metrics and KPIs. These most accurately reflect production volumes, defect rates, equipment productivity, etc. Next, we structured the indicators for reporting, agreed on the logic of calculations, the level of detail, and the frequency of data updates. After agreeing on the model, we created a solution in Power BI based on it. It is capable of transforming complex tables into visual, understandable analytics for quick management decisions.
Our collaboration with the customer transformed manual reporting into convenient digital management. Key implementation steps:
introduced an adaptive dashboard with filters by date, line, workshop, and shift;
the color indicators of deviations that we have added allow you to instantly identify problems in production processes;
Thanks to these solutions, data works faster and management is based on accurate indicators rather than guesswork.

Project duration
Project size:

Project complexity
Project status:
Planeta Kino is a modern Ukrainian cinema chain that has transformed the movie-going experience into a high-tech service.
View more
When we start working with world-class companies, we always focus on the speed of decision-making and strategic depth. We were...
View more
Skarbnytsia is the largest network of pawnshops in Ukraine, which has been engaged in private lending since 1992. The brand...
View more
Looking for a reliable technical partner? We are ready to join your project at any stage – from idea to launch.
Fill out the form, and we will contact you to discuss the project.
Senator Business Center, 32/2 Knyaziv Ostrozkykh St. Kyiv, Ukraine, 01010